MPT determines an investor's optimal asset allocation based on their risk profile and future cash needs. This article steps through how I determined my risk profile and future cash needs, and then used them to determine my asset allocation within my FI-investing strategy.
You might've come across Modern Portfolio Theory, or MPT, at some point during your investing journey. If you're like me though, you've found it difficult to figure out how MPT applies to you, and how to best implement it in your day-to-day investing strategy. Hardly surprising since Sharpe ratios, optimal portfolios and minimum variance didn't exactly come up in primary or high school…
A few years ago I had the chance to formally study Portfolio Theory, which meant that I finally could justify the time spent decyphering the jargon and beginning to figure out how to apply the core elements of MPT in my own investing strategy.
Now, after another few years of experimentation, I feel like I've got a pretty good grasp of the pros and cons of applied MPT-investing, and want to put my understanding on paper to test my own knowledge and strategy, as well as help you with yours, if that's what you're looking for.
Alright, time to get started, we're not getting any younger. Let's dive into MPT, specifically:
- So, what is MPT again?
- Ok, enough theory! How do I put it into practice?
- MPT and my investing strategy for FI
So, what is MPT again?
MPT is a Nobel Prize-winning investment theory pioneered by a bloke called Harry Markowitz in 1952 that today forms the basis of how most how professional investors put together their portfolios, including Hedge funds, Managed funds and Super funds. It states that since most investors are risk averse (i.e. don't want to lose money), they require more return for taking on more risk, that for each level of risk there is a corresponding combination of assets that maximises return, and that of all these portfolios, there is one that maximises the risk-return trade off - this is known as the Optimal Portfolio.
Note that the risk accounted for in this trade off is "systematic risk," which means the risk factors that are present affect the whole market and cannot be eliminated through further diversification. This type of risk is measured as standard deviation, and therefore is a measure of how extreme market movements are, not necessarily the risk of losing your capital. We'll get into the difference in more detail later.
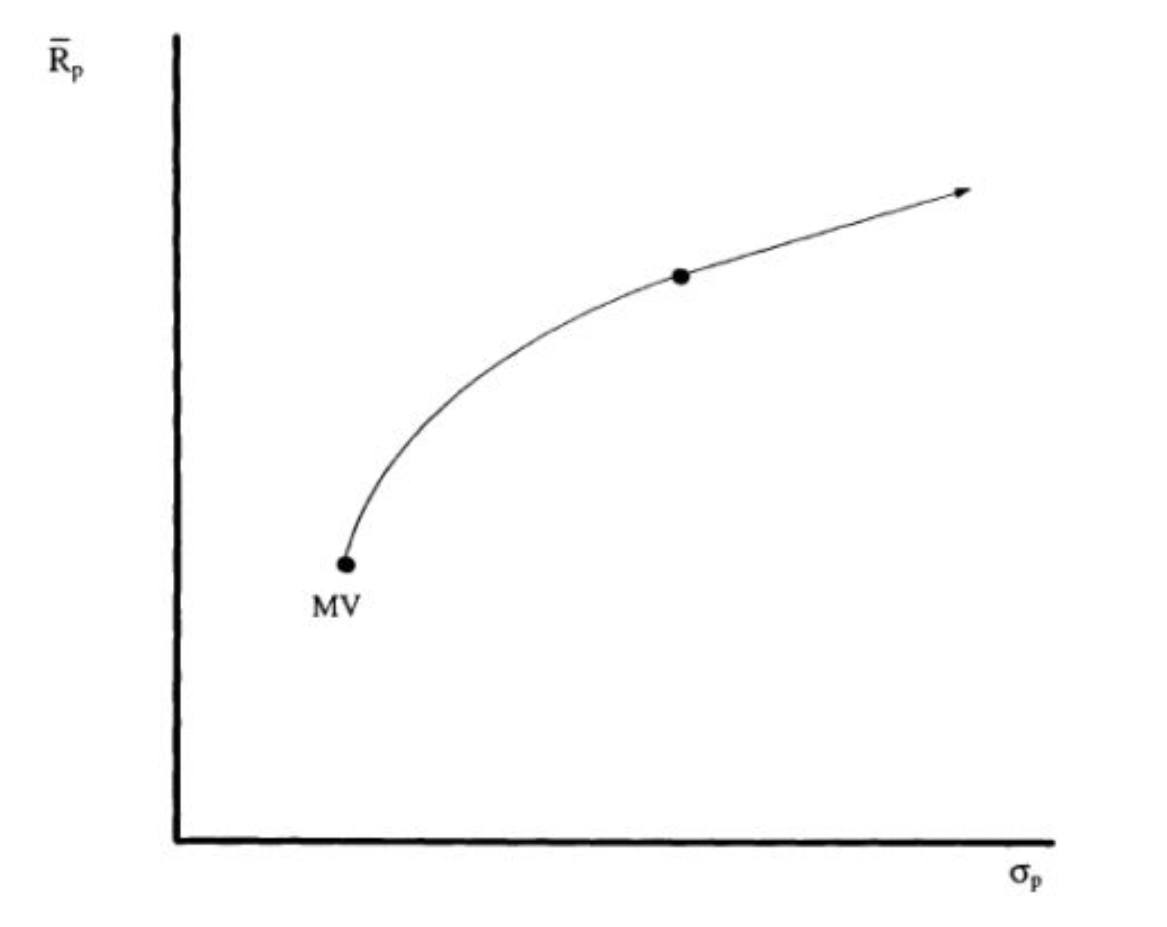
Ok, so here's what the range of portfolios (known as the efficient frontier) looks like. The right axis is return (% pa) and the horizontal is standard deviation. The line is the efficient frontier. MV stands for mean variance. The efficient frontier is comprised solely of non-cash assets.
So, where on the efficient frontier is this optimal combination of assets?
To figure that out we first need to introduce the concept of the risk-free rate, or Rf, which is the rate that investors can borrow or lend money at. Theoretically, Rf allows us to lend money by buying risk-free assets with extra cash, or borrow money by loaning some extra cash to invest in the optimal portfolio.
Then, if we draw a line between Rf and the efficient frontier, the point on the efficient frontier that maximises the slope is the optimal portfolio (i.e. point B = Optimal Portfolio in the graph below).
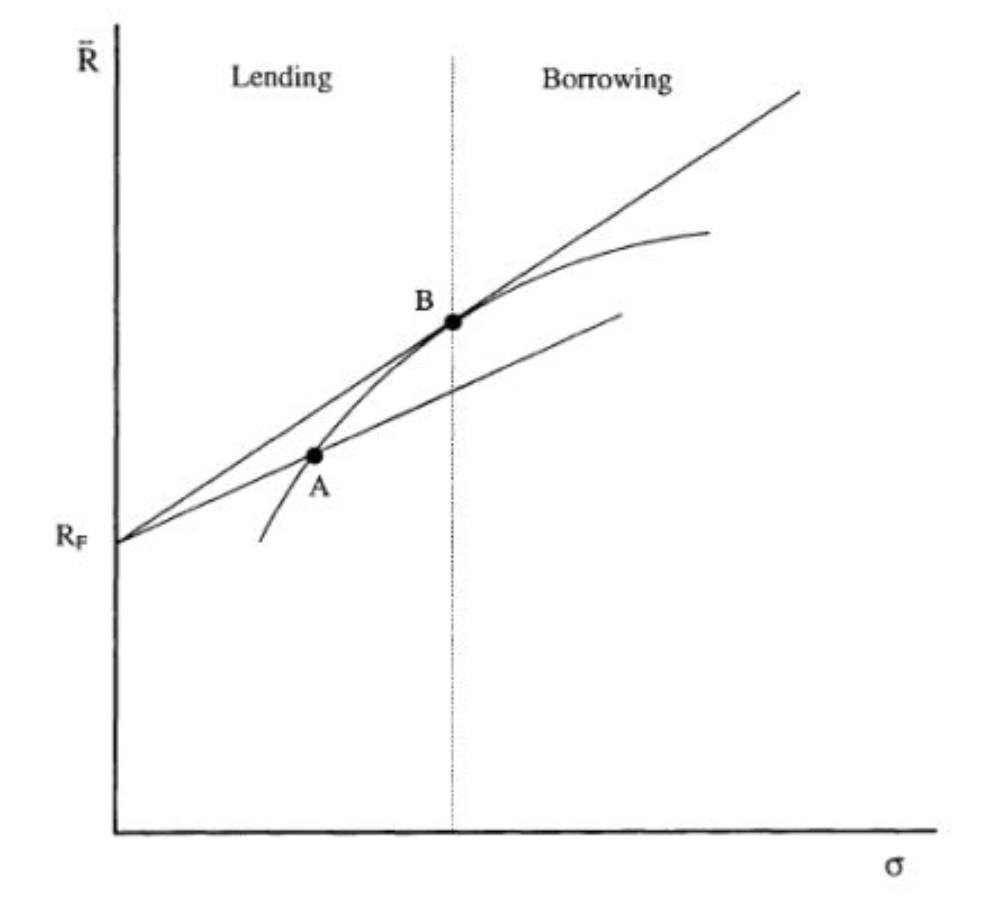
Note that the gradient of the line between Rf and B is theSharpe ratio and the line itself if called the Capital Market Line. This means is that the portfolio of assets at point B maximises the Sharpe ratio and the best return achievable in the Market for any level of risk is plotted along the Capital Market Line.
So, how we move along the Capital Market Line? Well, any of these points can be achieved by allocating a proportion of funds to the optimal portfolio and the rest to cash. We can even allocate a negative proportion to cash, i.e. we move along the line by lending or borrowing at Rf.
Theoretically, investors move along the line to their own "happy risk point" by lending or borrowing at the risk free rate to maximise the return they get for the amount of risk they're willing to bear.
Problem is, in practice, investors cannot borrow at the same rates they can lend. Investors can lend close to 'risk-free' by buying government bonds, however, we will always pay a higher borrowing rate than what we can lend at.
So, if our lending rate is different to our borrowing rate, then the capital market line becomes kinked, as shown below.
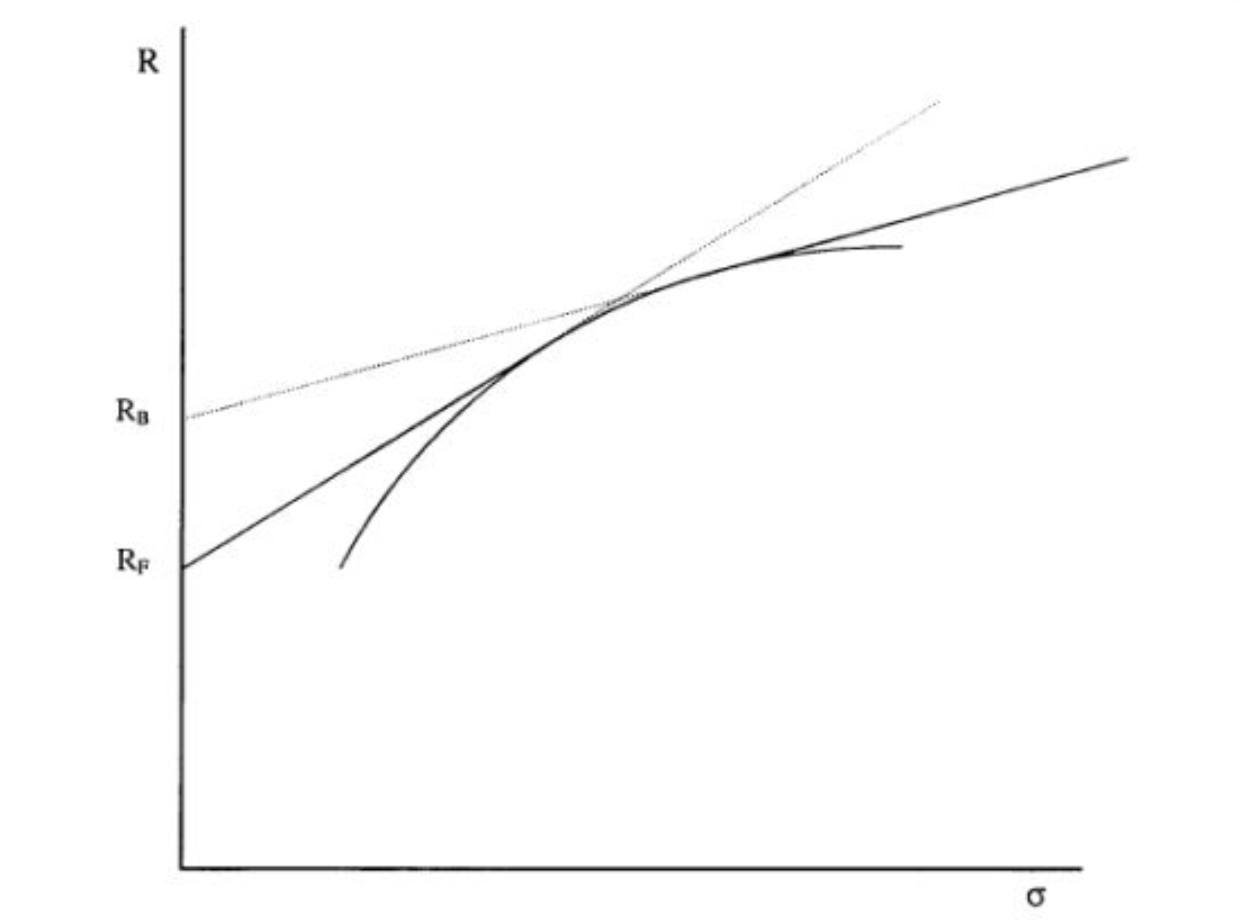
In this case, instead of having one optimal portfolio, there is a range of optimal portfolios between the two points of intersection of Rf and Rb. The higher the difference between Rf and Rb the greater the number of optimal portfolios and the more the benefit of leverage is reduced. Using current figures, AU Government bonds yields are around 1.5% pa, but most margin loans will cost you closer to 5% pa. So yes, it seems like an unfair trade, plus there's a bit of work involved in setting up margin accounts and monitoring asset values, so that's why for a long time I'd dismissed leveraged investing as a viable option for my own portfolio.
Ok, enough theory! How do I put it into practice?
Well, MPT is built around the concept of an optimal or market portfolio. In theory, this optimal market portfolio is a bundle of investments that includes every type of asset available in the world financial market, with each asset weighted in proportion to its total presence in the market (yes, the name kind of gives it away)! But how do we invest in every asset in the world in the right proportions?
Simply put, we can't. We're retail investors with limited time on our hands. But, by using ETFs we can get close enough with not much effort.
First, we need to decide on how much risk we're comfortable with. As mentioned before, I don't think of this risk as risking capital loss because it's not. Standard deviation is a function of volatility, not permanent loss and therefore the true risk is being unable to withstand temporary value decline, psychologically or financially. This is a subtle difference but an important one. The question I often hear new investors being encouraged to ask themselves is 'can I afford to lose this money?', which is just so wrong. Thinking this way further reinforces the misconception that investing is gambling - the same misconception that stops so many Aussies from becoming investors in the first place. Instead, the question should be 'what temporary value decline am I psychologically comfortable with and when might I need to access the capital I've invested?' *
So, there are two parts to this question. Firstly, how can we measure our psychological ability to withstand temporary value decline? And secondly, what are our future needs for our invested capital?
I think we can use past experience as a conservative way to estimate our psychological tolerance to temporary value decline - e.g. think about what's been the worst decline you've been able to ride-out and go from there. For me, this was the GFC. I made my first investments in 2007 and come 2008 my investments were worth 75% less (perfect timing!). I didn't sell any shares until 5 years afterwards so I expect I can ride out another 75% value decline, if it were to happen. **
But what if you haven't had to deal with a market crash yet? Or you think my past-experience approach sucks? Well, you're in luck. There are a bunch of Risk Profiling quizzes you can take like this FinaMetrica one. If you're a student it's free, you just need to sign up with your .edu email. The front page of my report is below. My results were what I expected. I imagine most FI-investors would be towards the upper end of this range.

Together, these two methods should give you a solid understanding of your investing psychology.
Next, we've got to consider our future needs for invested capital, both planned and unplanned. This is hyper-personal and I don't know of a broad way to give guidance here, but here are my circumstances:
- I don't intend to access my current investment capital ever. This capital and a portion of my future capital is being used to become FI (financially independent), my #1 financial goal.
- I haven't set other personal financial goals yet and apart from a lumpy income, my financial affairs and commitments are uncomplicated - not married, no dependents, etc.
- When new goals do arise, I expect to be able to save for them in a way that doesn't compromise my FI-investing strategy.
- In particular, when my life circumstances change and I want to purchase a house and other big-ticket items, I don't think my need for capital to purchase these items will ever be so urgent as to force me to sell at bad prices, if I need to sell at all.
- I have private health insurance and always cover myself with travel insurance when abroad.
- If absolutely everything goes wrong I have a family safety-net to fall back on.
The outcome of my personal circumstances is pretty simple. I intend to never need my invested capital that I put towards FI for anything other than achieving FI, and I am confident my circumstances will allow me to do this for the next 20 years.
But what if it wasn't so straightforward? Let's say that I plan on using this capital for a home deposit in 5 years time. How should I change my strategy?
Well, for me it would depend on how fixed I am on that 5-year timeline. If I would like to own a home, but not have to, then my strategy would remain very similar - I would just invest in the way that maximises my return over the long-term. If the sharemarket plugs along normally I'll be fine, and if it shits itself I will just wait until it rebounds. Of course, this all changes if I must buy a home in 5 years. In this case, and with a 5-year timeline, my capital really isn't safe in the market. Historical figures suggest I could lose up to 12% capical investing over rolling 5-year periods, and 37% over rolling 1-year periods. So the decision now becomes a toss-up between how much I am willing to risk having to purchase a less expensive property vs the additional expected return. The difference is ~2% per annum in a HISA vs ~10% per annum in the market, or about 5x! Note that this isn't a static decision either, because as the timeline becomes shorter my risk of capital loss increases. It's a tough call that will be unique for everyone - far simpler to avoid getting into the position where I must do anything with my capital, I reckon.
So, taking stock of my situation: I've got no fixed future obligation for invested capital and I've withstood a ~75% temporary value decline before. This means for I can withstand a lot of volatility and so I am a fair way to the right on the horizontal axis below. As you can see, I'm past 'the kink' and so should theoretically have a leveraged portfolio with a mix of bonds and equities.
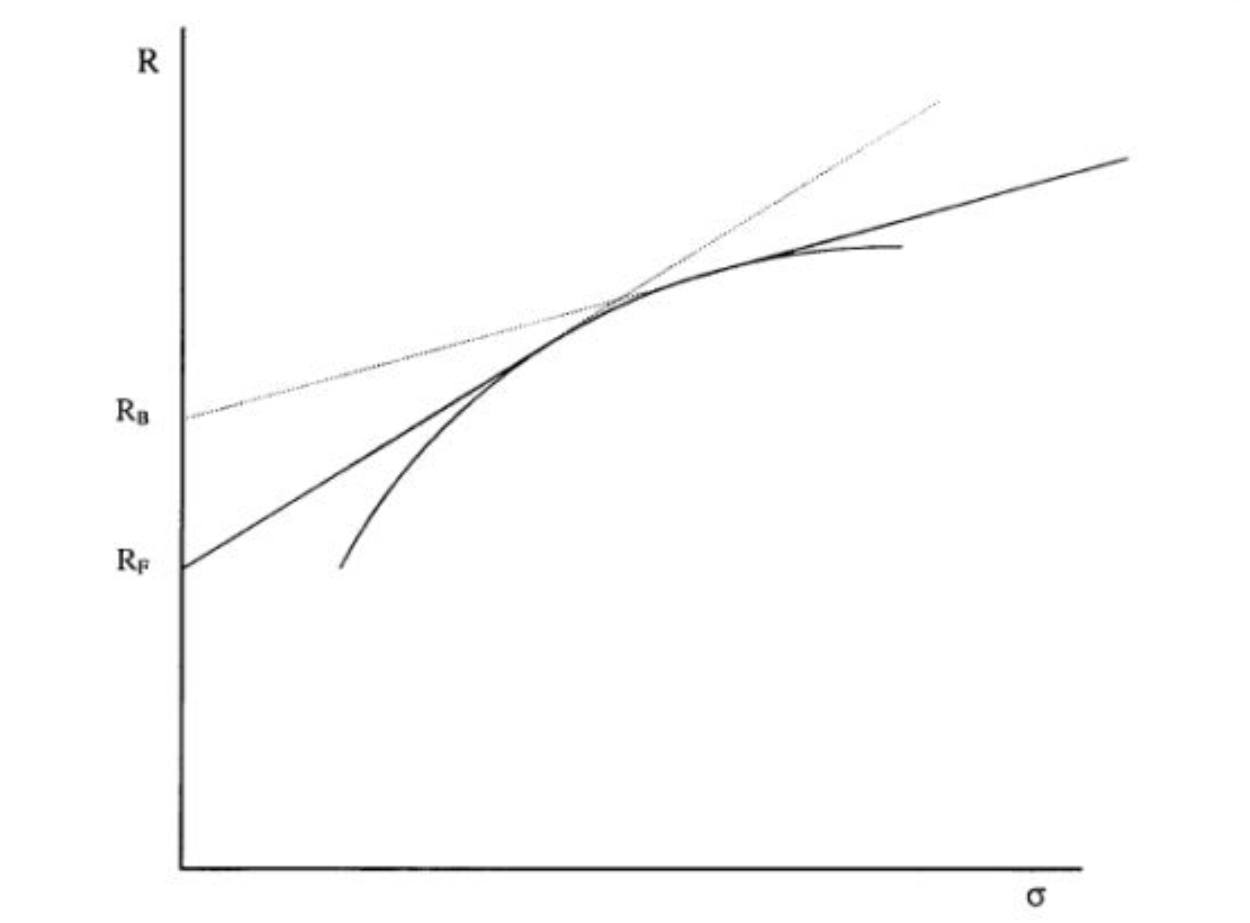
Up until recently though, I wasn't aware of any viable ways for retail investors to invest with leverage. The costs of margin loans (~5% pa + active monitoring) just didn't make sense, so my strategy to cost-effectively maximise my return had been to invest all my cash in AU & global equity ETFs and forgo bonds completely, as per the efficient frontier asset allocations below. ***
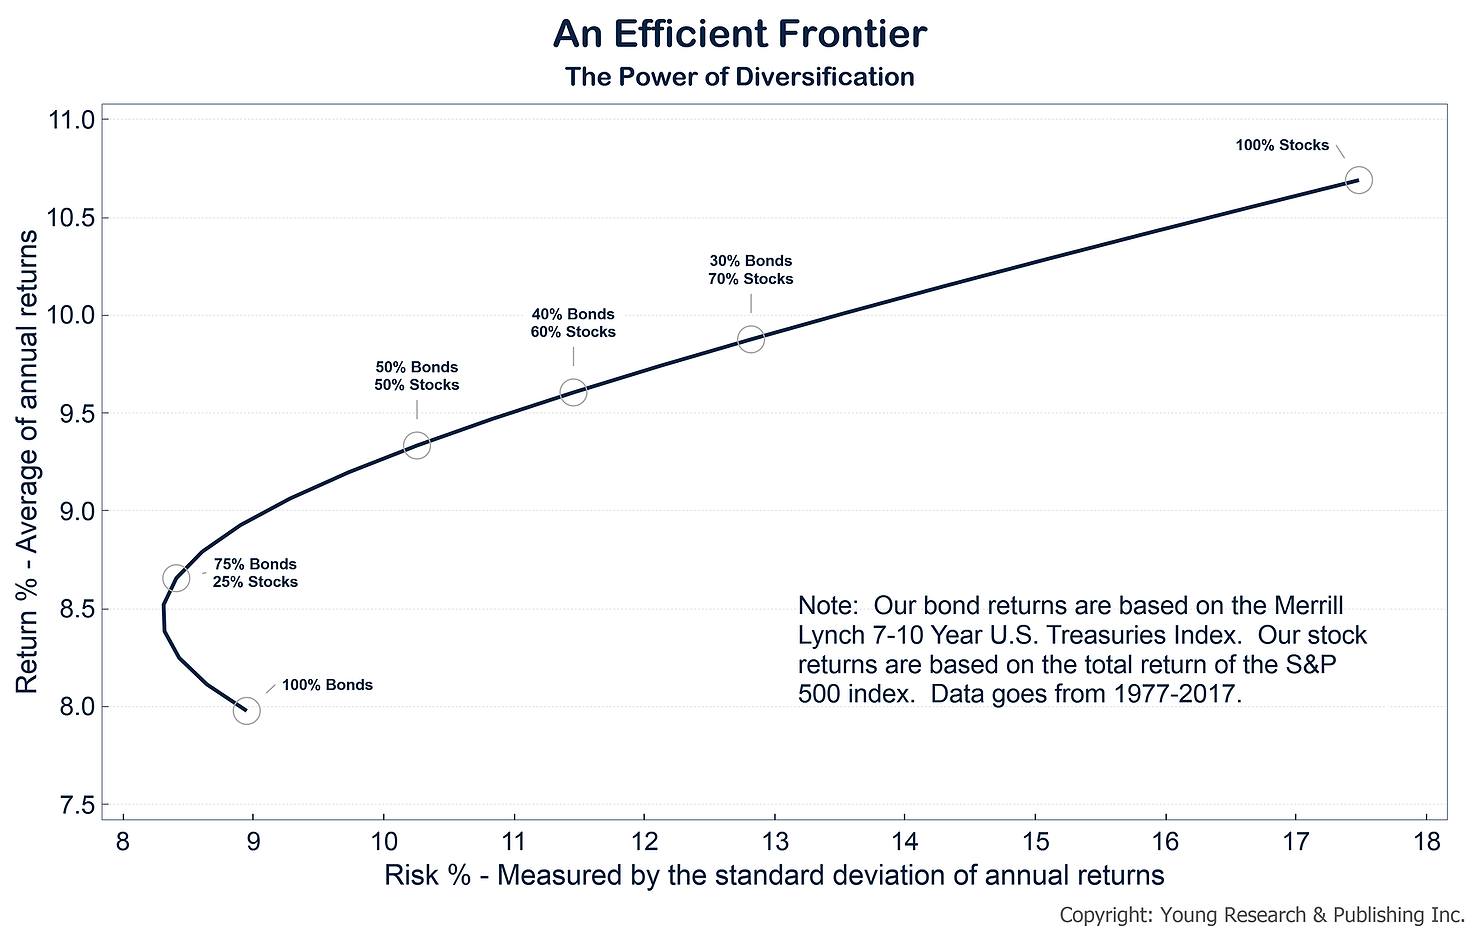
Theoretically, MPT uses the market-weighted portfolio (an all-world, all-equity, market-weighted portfolio with assets allocated based on risk profile). In practice though, there are regulatory benefits for Australians to invest in Australia (franking credits and dividends), which are the main reason that the ideal all-equity portfolio for an Australian has a much higher concentration of Aussie equities than 'market weight'.
Initially, my target allocations were roughly 1/3 Australian equities, 1/3 US equities and 1/3 All-world Ex-US equities. I'd read that the US sharemarket represented about 50% of the world's market capitalisation so I thought that the US/All-world Ex-US balance should be roughly 50/50. To account for the franking tax benefit, I allocated an equal proportion to AU equities too.
For complete transparency, I've also invested meaningful amounts in a couple of peer-to-peer and pooled funds in the past. They advertised comparable returns to equities by providing mortgage and SME loans, and I thought having different asset classes would be good for my portfolio's diversification. I also just like playing around with new Fintech platforms. I've put some money in a few non-listed companies (mostly friends' startups) and in cryptocurrency too, though I've made these investments more because I believe in the people and the technology, rather than trying to earn a return, so I haven't been counting these investments as part of my Net Worth.
MPT and my investing strategy for FI
These days I am still accumulating Australian, US and all-world Ex-US ETFs (A200, VEU and VTS), though my target allocations aren't quite as simplistic as they used to be. Thanks to The FI Explorer, I came across the Optimal Domestic Equity Allocations for Australian Investors and the role of Franking Credits paper- I'll be posting my analysis of this soon, but essentially it highlights the risk-optimised international vs domestic equities allocation for an individual with a 45c marginal tax bracket. My new allocations are based on applying the results of this study to my own circumstances (and tax bracket!).
I've also recently become aware of some leverage investing options that are much more cost- and time-efficient than the traditional margin lending approach. One of these options is to use Internally Geared ETFs, which are effectively corporate margin loans for retail investors. They are a relatively new product category and there are only two ASX-listed options - GEAR which tracks the ASX200 and GGUS which tracks the S&P500. Currently, the borrowing rate for them both is ~2% and the leverage is centrally managed by the ETF provider, making them much more time- and cost-efficient than the traditional margin loan alternative. As a result, I am accumulating GEAR and GGUS too. To learn more about these, read my detailed anaylsis of internally Geared ETFs. Note: I have a very high risk tolerance, Internally Geared ETFs are not for most people.
Together, A200, VTS, VEU, GEAR and GGUS form the entirety of my current target portfolio. As I become more confident with Internally Geared ETFs and more Internally Geared ETFs become available, I may phase out the unleveraged ETFs from my target portfolio and invest new funds solely in Internally Geared ETFs. But that will take a while…
This 100% leveraged equity exposure isn't theoretically risk-optimised, but I haven't been able to find a way to invest with leverage in bonds in a cost- and time-effective way yet. Who knows, maybe some Bond Internally Geared ETFs are around the corner?
Happy FI-ing,
Kurt
*This is the part where the past performance is not an indicator of future performance BS disclaimer usually features, but I'm taking a stand because if your time horizon is long enough and you invest with adequate diversification, your chances of permanently losing your capital are zero, unless the world suffers a cataclysmic catastrophe (then we're all F###ed). What is an adequate diversification/time horizon mix? And what's a cataclysmic catastrophe? Well, if you invested in the top 500 companies listed in the US alone, there's not one rolling 20-year period since 1872 that would've lost capital value Not one of the world wars, financial crises or natural disasters was enough of a catastrophe to stop the relentless progress of the US market for 20 years.
** Note that I actually don't expect a 75% decline to happen again. It happened in 2007 because my parent's stockbroker opted to give me his shitty stock tips rather than suggest something sensible like an ETF… it was a painful lesson on how unprofessional the finance industry can be, but also a very valuable one to learn at 15. In hindsight, I've probably got a lot to thank him for…
*** It's important to make sure that the dataset of the efficient frontier you're using is over a sufficiently long time frame. Crudely applying MPT with short-term data can have an over optimisation problem, i.e. it will just pick and promote recent 'hot' asset classes.
A big thanks to d42.com for providing most of the efficient frontier images used in this article.
At Pearler, we pride ourselves on the quality of the general financial advice we give. Please note though, that this advice has not been tailored for you. You have unique financial goals, circumstances and needs which may make this advice inappropriate, and it is important that you know whether it applies to you. If you are unsure we urge you to speak to someone you trust who is competent with money and understands your individual needs, whether they be a trusted friend or accredited professional.


