On average, Pearlers check their portfolio twice a week. When we looked deeper, though, most of us are spending time reading a blog; listening to the Get Rich Slow Club or Aussie FIRE; or tinkering with a calculator.
So, we're keeping tabs on our investments, but spending more time investing…in ourselves ;)
And for the 5% at the Espresso Martini end of the spectrum, we hope your New Year's Day hangover isn't too bad…
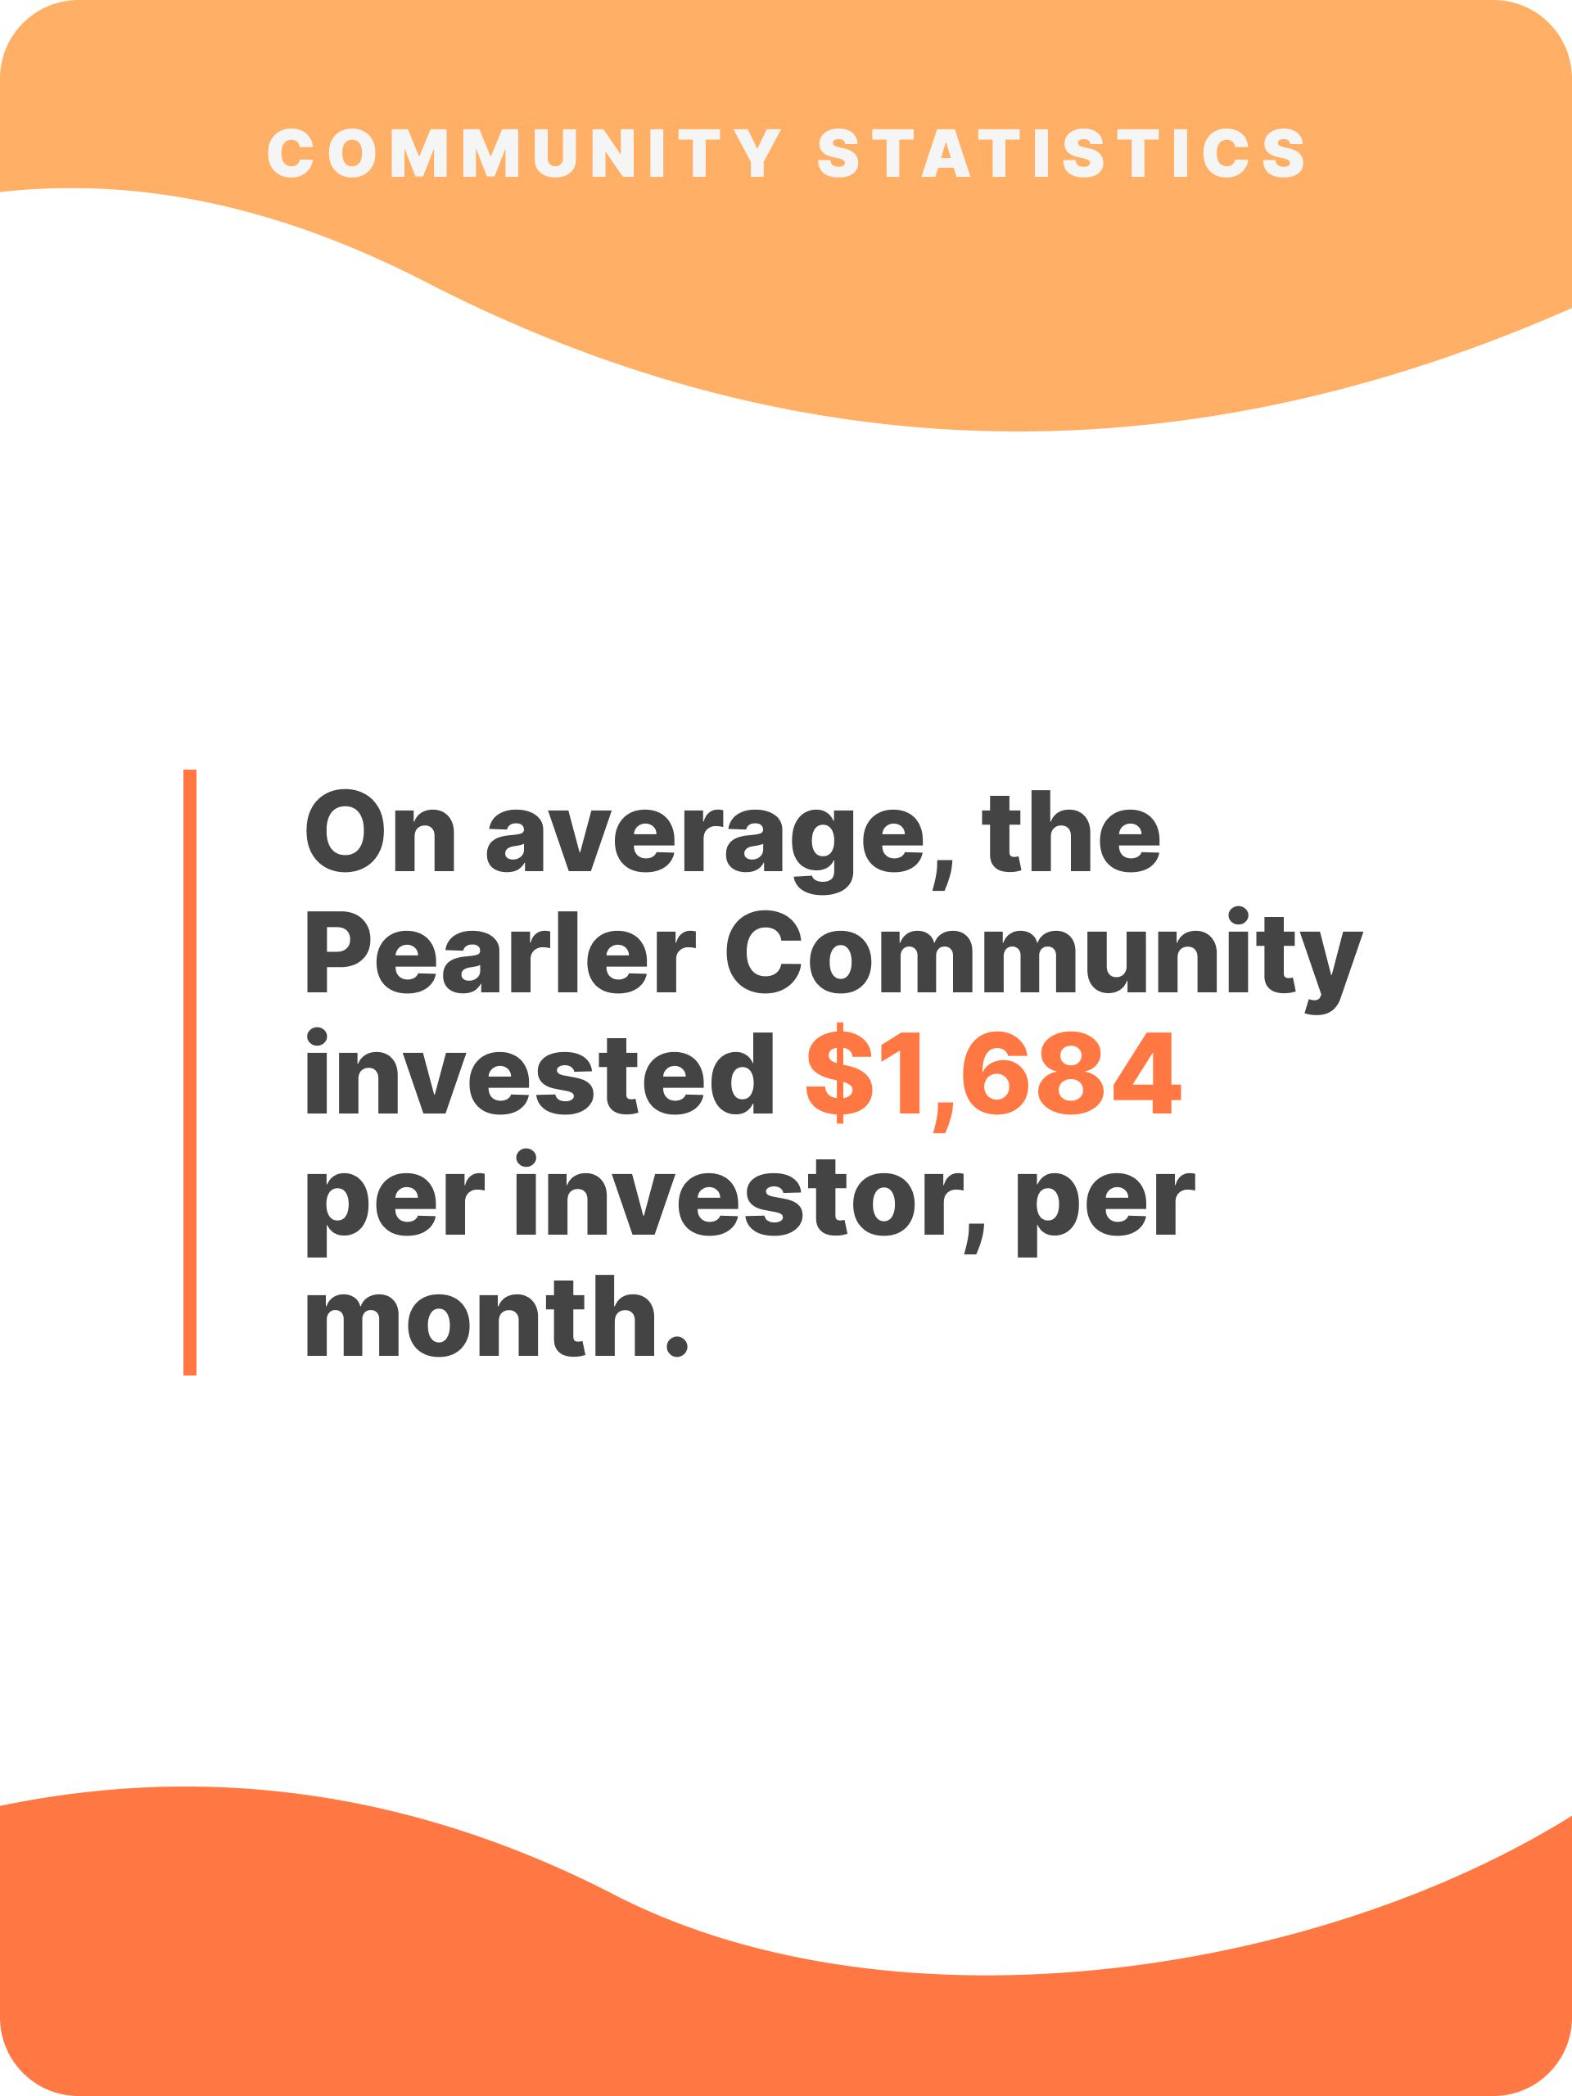
This average stat is made up of over a hundred thousand investments, with the smallest being under $1 and the largest being, well, large. We are here for all investors, beginner to pro, from a few cents to your life savings.
To bring it back to the average, that's $20,208 a year. But to put it more attainably, that's around $55.40 a day.
That's a (small) round of drinks at a dive bar, or a (small) Uber Eats order for two, or a (long-ish) rideshare during peak hour.
Which brings us to our next point…
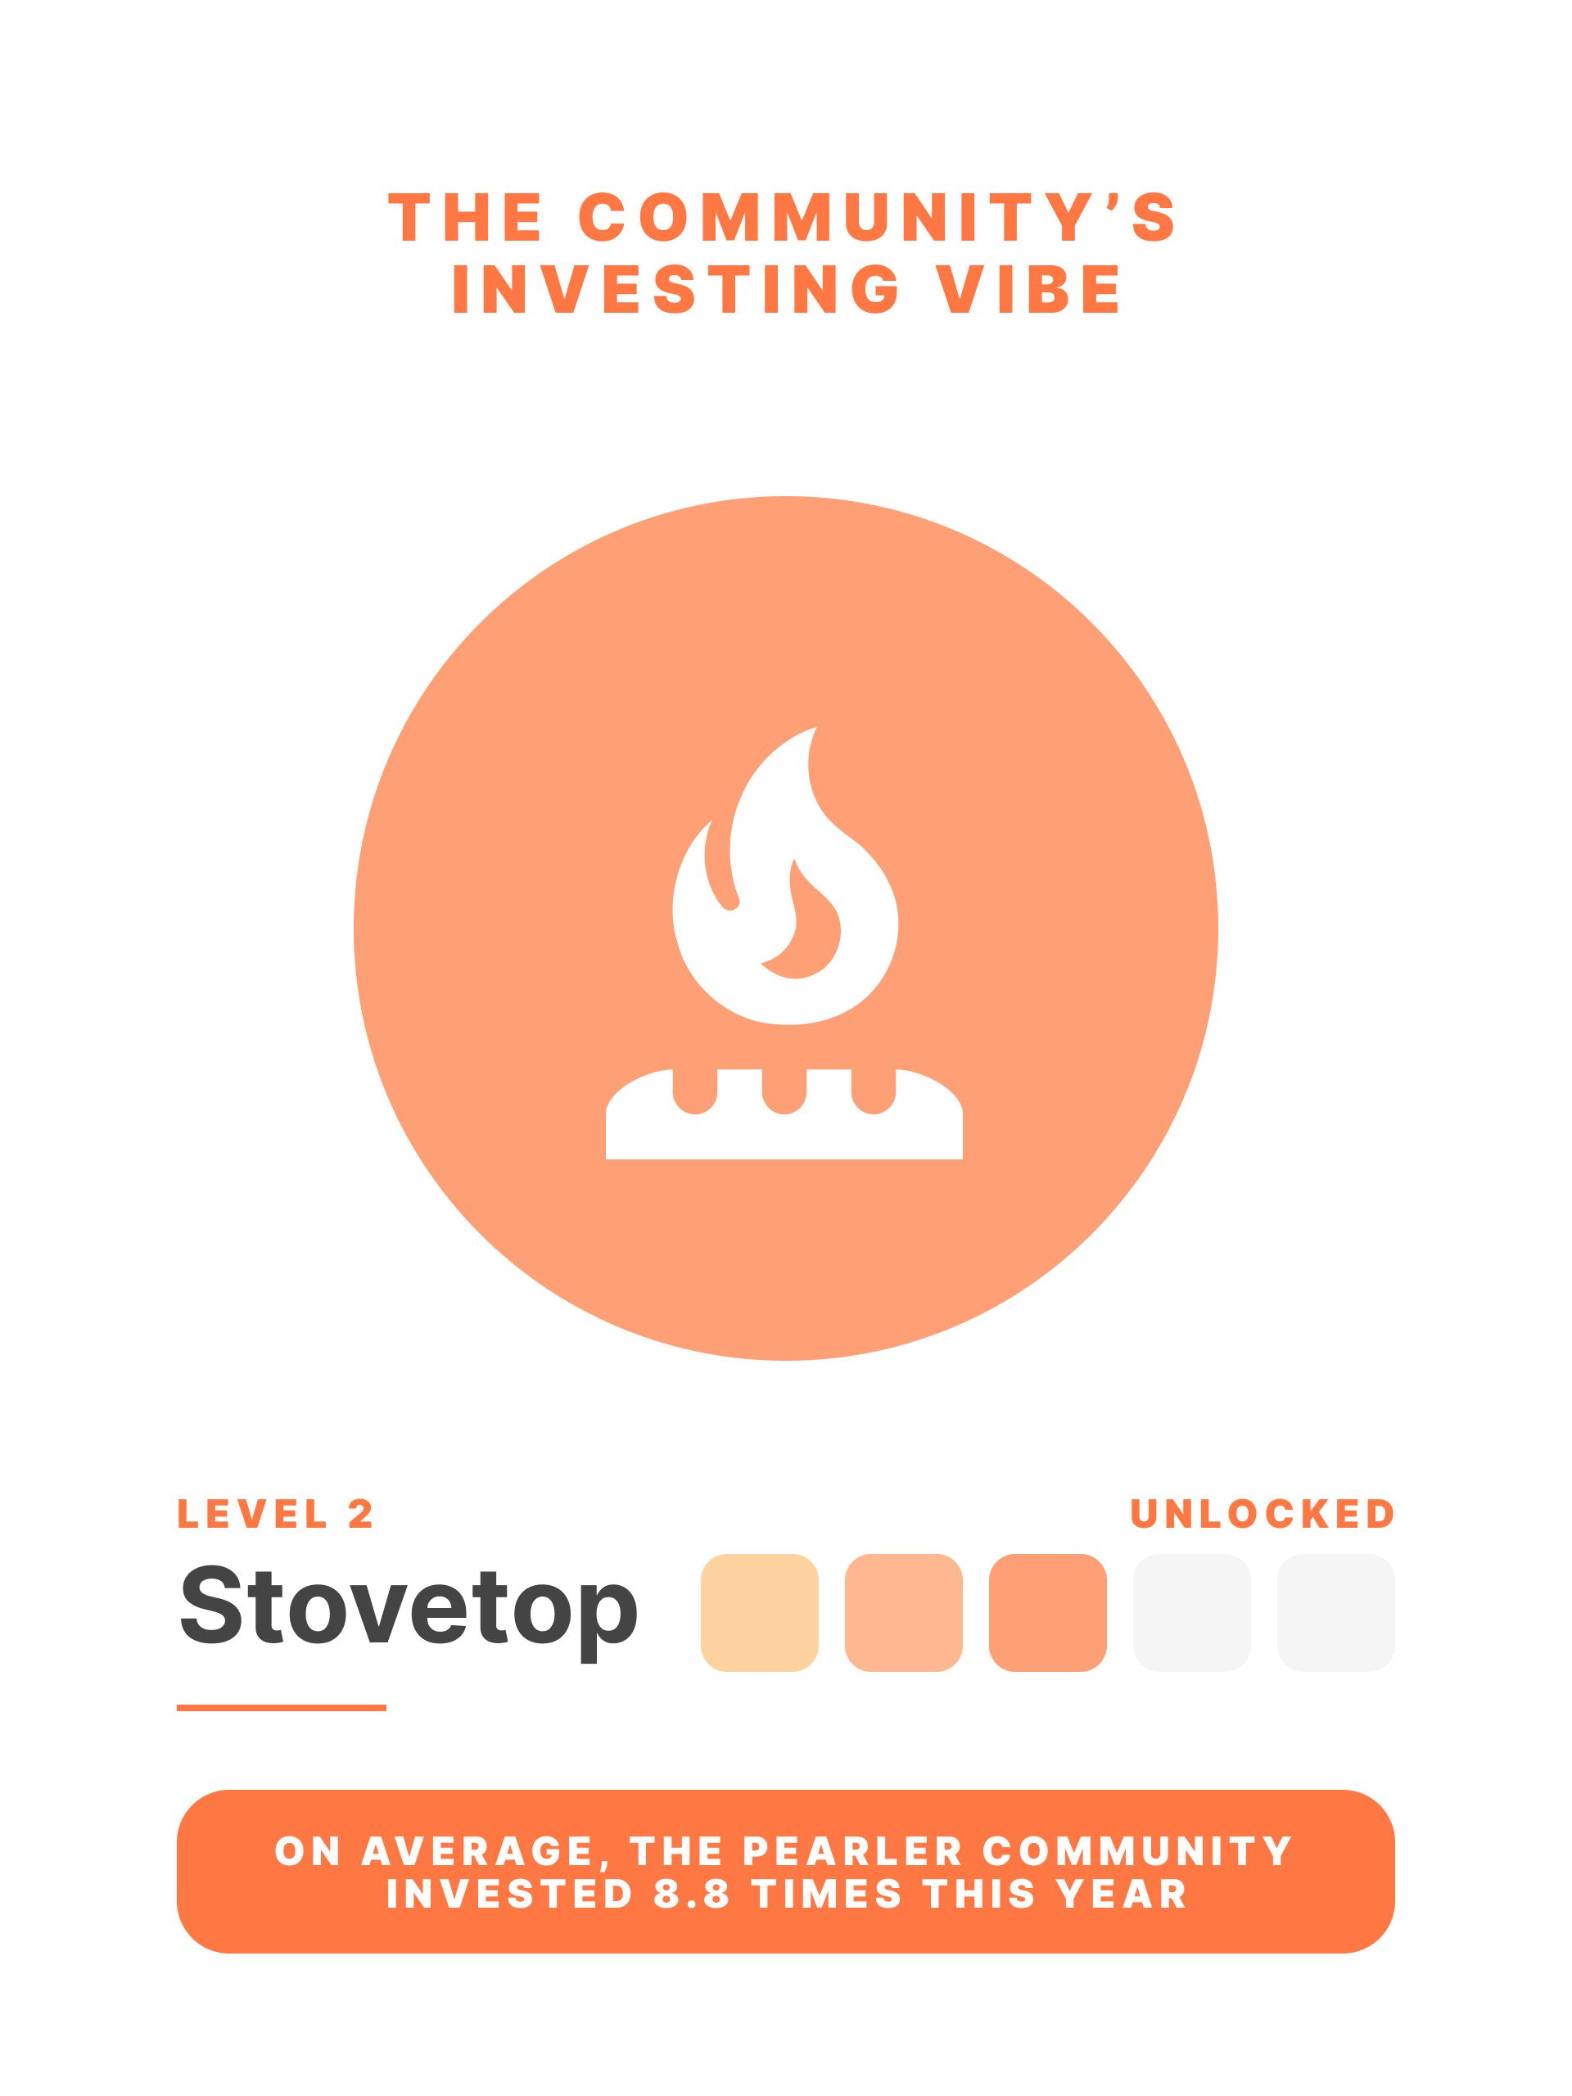
What is a Stovetop?
At Pearler, we love FIRE (or Financial Independence, Retire Early) for how easily it can help everyday people, regardless of how deep they go. And as you may have noticed, we also love wordplay.
That's why we define our community's investing frequency by…fire types.
Spark is the lowest, and Bonfire is the highest at 18+ times a year. On average, the community invested about every 6 weeks - which makes them a Stovetop.
With an average of 8.8, our investing frequency is only one decimal point away from Succession's IMDB score. Let's reach 9.0 next year - then we'll show those nepo babies!
If none of this made any sense, hang in there. We've got some hard numbers below.
Pro tip: ignore this next section!
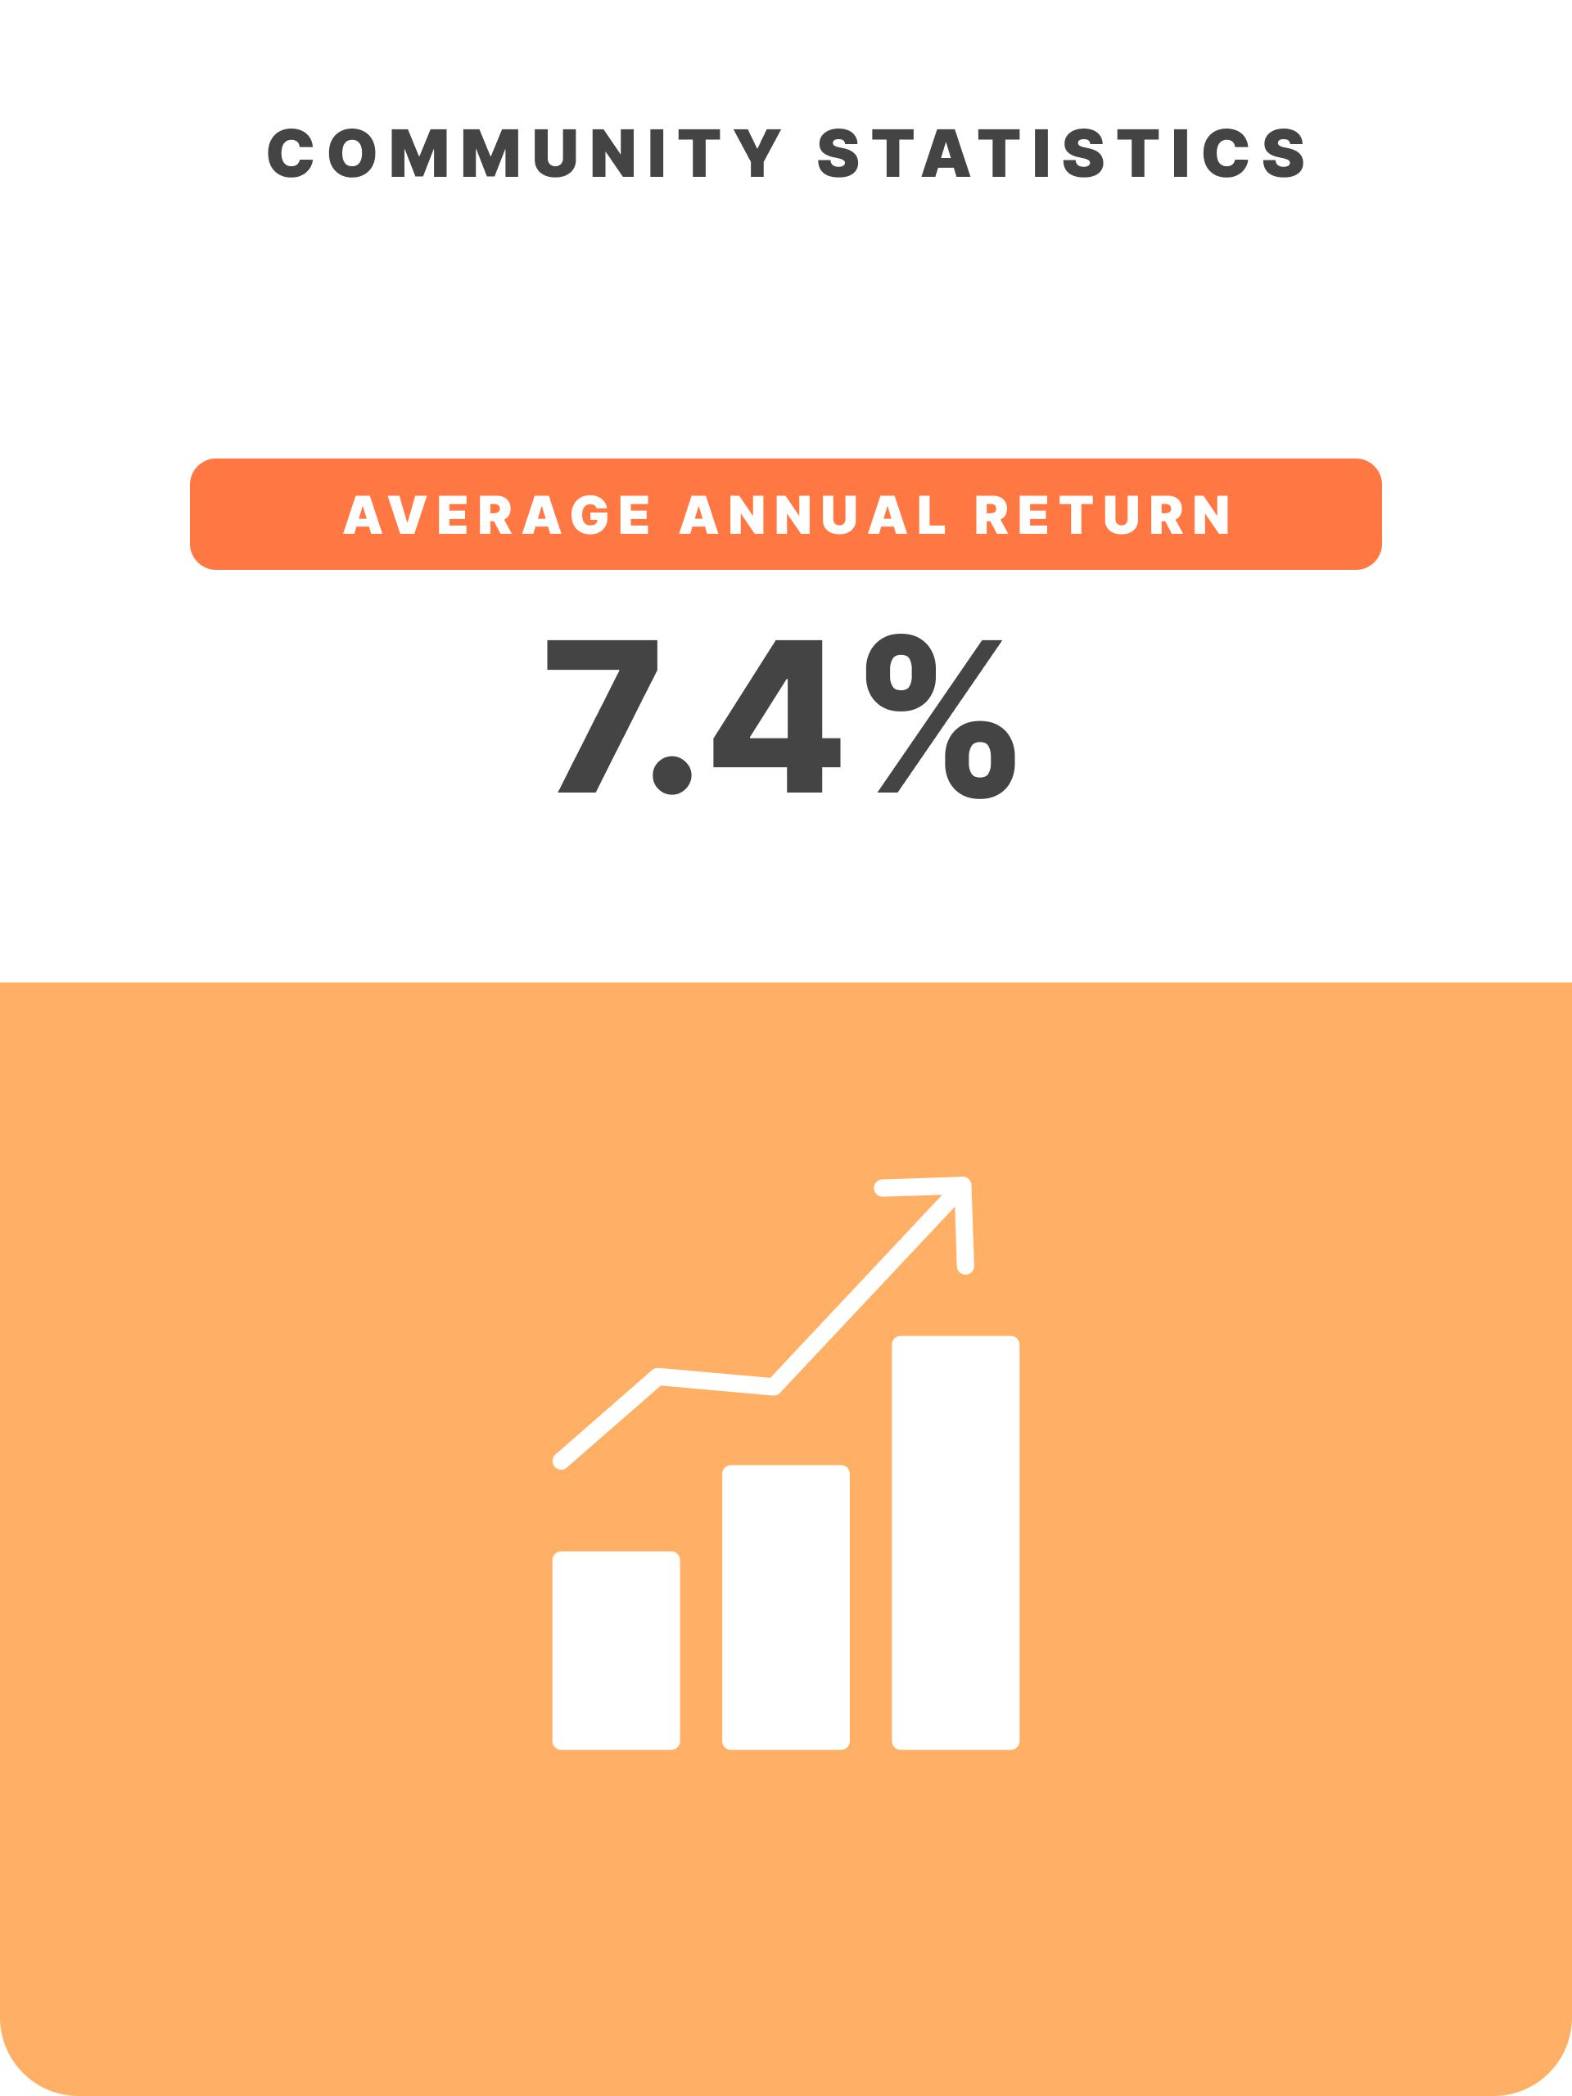
Short-term returns have nothing to do with you and your long-term goals. Why do we share the year's returns, then? To show that, as a community, we are getting close to 'market returns' at all times - rather than chasing the next hyped stock.
So, fair warning: look away if you don't want to know.
It didn't start well, but lately there's been more to smile about.
This figure is easy to track, since the majority of the Pearler Community invest in ETFs that track the market. In fact, Pearler's top 10 most popular investments are all ETFs.
Do you have a Pearler account? Check out your personalised Financial Year in Review!